Capstone Project · NIIT Data Analytics with GenAI
LogiTech —
Logistics & Warehousing Analytics
An end-to-end analytics project focused on shipment delivery, warehouse operations, inventory management, financial performance, statistical analysis and shipment-cost prediction.
Project Overview
From operational data
to business insights.
The LogiTech project analyzed logistics and warehousing data across shipment delivery, warehouse operations, inventory movement and financial performance.
The project combined multiple analytics tools to create a complete workflow — from data preparation and SQL analysis to visualization, statistical validation and predictive modeling.
The objective was to identify operational inefficiencies, understand cost drivers, evaluate warehouse and inventory performance, and generate insights that could support data-driven decisions.
Total Records
211,457
Across the project datasets
Shipment Records
209,402
Shipment delivery dataset
Inventory Records
2,036
Stock movement records
Warehouse Records
19
Warehouse operations
Business Objectives
Six analytical questions.
01
Delivery Reliability & Cost Efficiency
Analyze shipment and delivery performance using Excel.
02
Warehouse Capacity & Operational Efficiency
Evaluate warehouse utilization, labour effort and fulfillment using SQL/MySQL.
03
Inventory Management
Analyze stock levels, reorder requirements and carrying costs using Python.
04
Financial Efficiency
Analyze shipment, warehouse and operational financial KPIs using Power BI.
05
Statistical Analysis
Apply hypothesis testing and statistical techniques to validate relationships in the data.
06
Shipment Cost Prediction
Compare regression models to predict shipment costs using machine learning.
Analytics Workflow
One project,
multiple analytical layers.
01
Prepare
Clean and organize raw datasets.
02
Excel
Analyze delivery and shipment KPIs.
03
SQL
Evaluate warehouse operations.
04
Python
Perform EDA and statistical analysis.
05
Power BI
Build financial and operational dashboards.
06
ML
Predict shipment costs.
Dashboard Gallery
Visualizing the
business story.
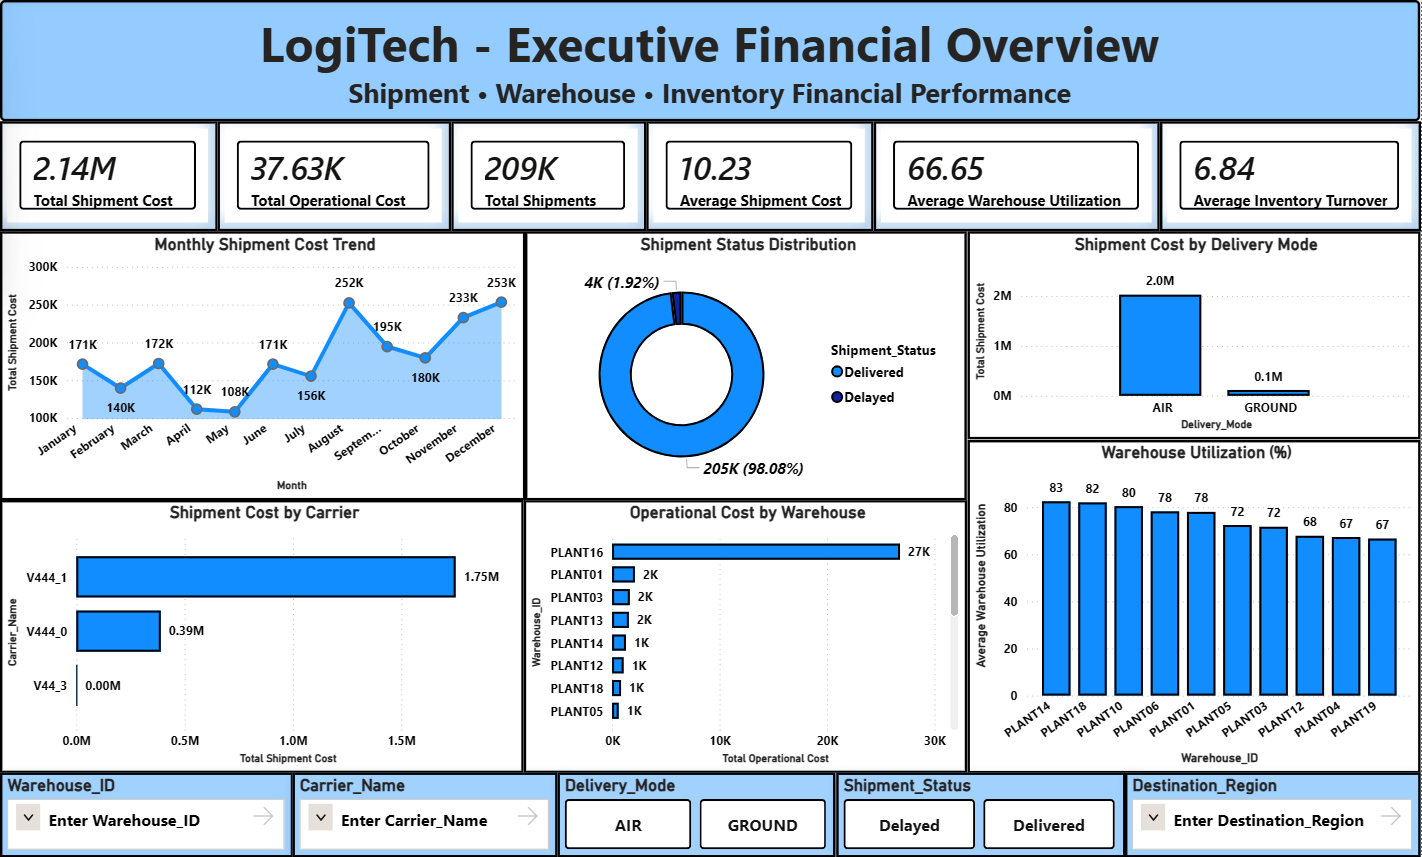
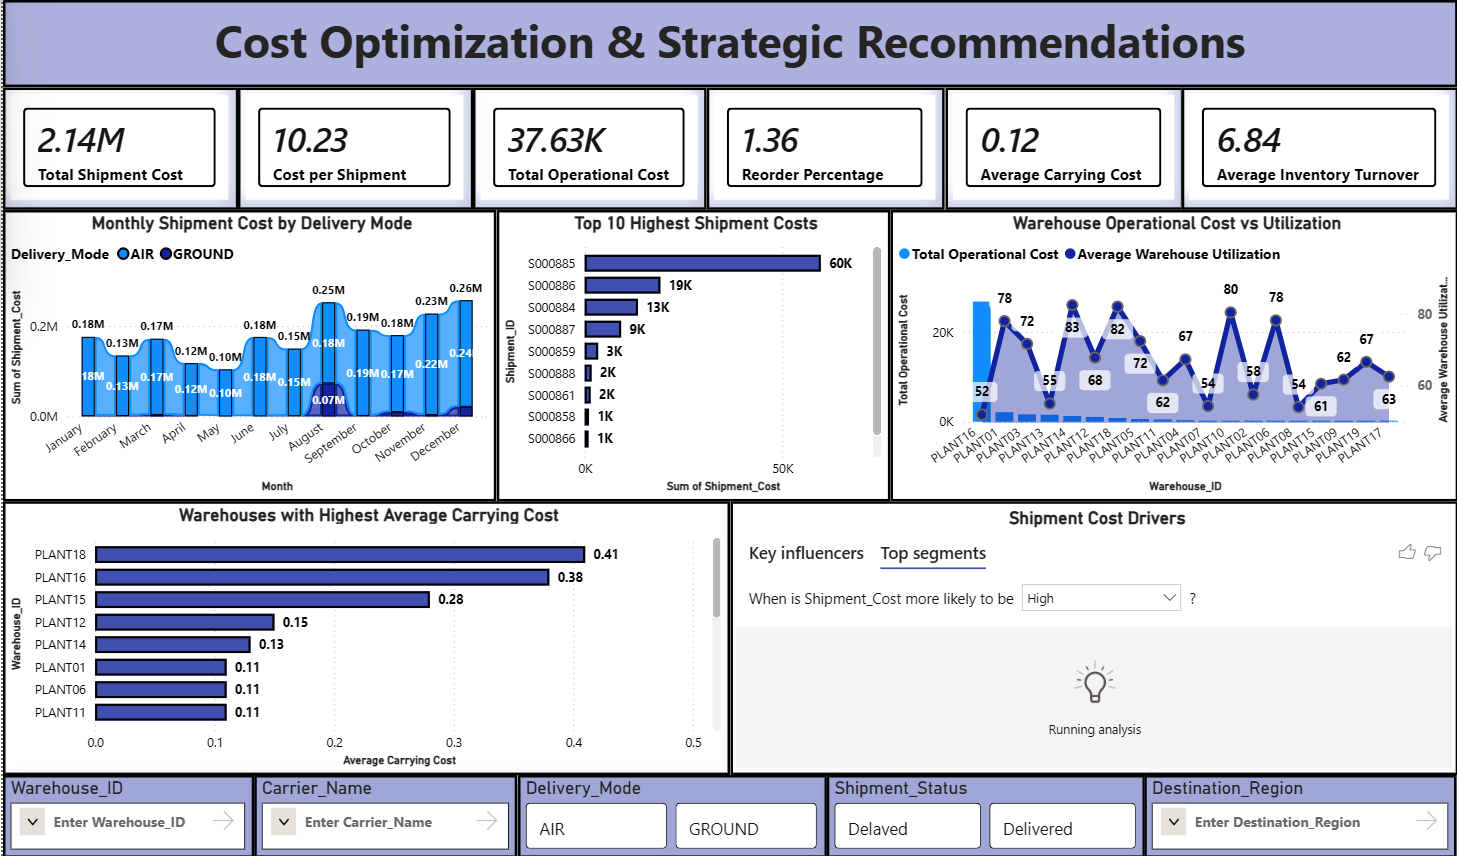
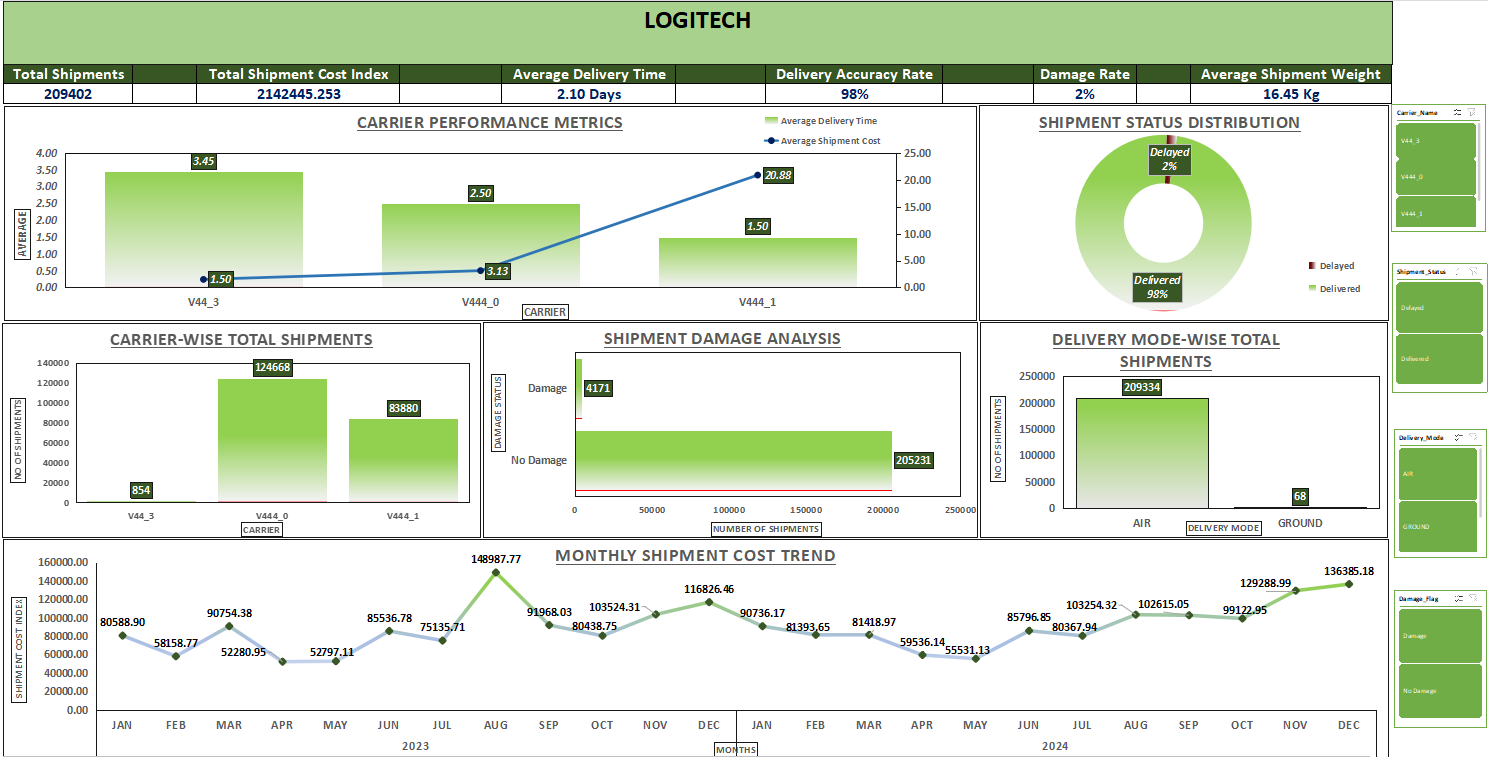
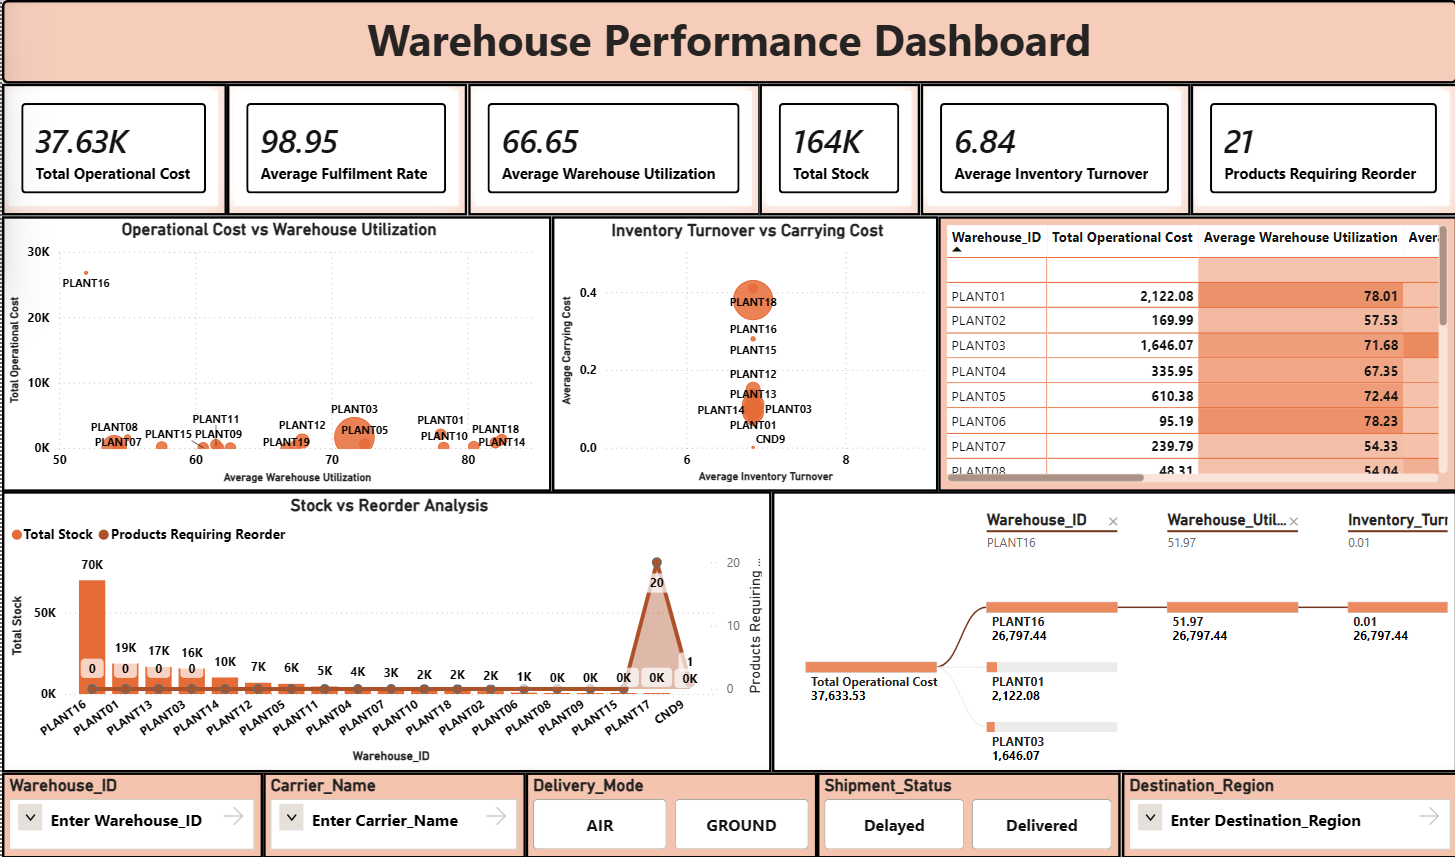
Interactive dashboards were used to communicate operational, financial and warehouse insights.
01 · Power BI
Executive Financial Overview
02 · Power BI
Cost Optimization & Strategic Recommendations
03 · Excel
Logistics & Delivery Performance Dashboard
04 · Power BI
Warehouse Performance Dashboard
Statistical Analysis
Testing relationships,
not just visualizing them.
t-Test
Air vs Ground
Significant difference in shipment costs.
Pearson Correlation
Utilization vs Cost
Relationship was not statistically significant.
One-Way ANOVA
Carrier vs Cost
Carrier selection significantly affected shipment cost.
Chi-Square
Mode vs Status
Delivery mode and status relationship was not significant.
Machine Learning
Predicting
shipment cost.
Multiple regression approaches were evaluated to identify the strongest model for shipment-cost prediction.
BEST EVALUATED MODEL
Random Forest
MAE
10.78
RMSE
20.40
R²
0.30
Feature Importance
Key Insights
What the data
revealed.
Delivery accuracy was approximately 98%, with damage rate around 2%.
AIR dominated shipment volume with 209,334 shipments compared with 68 GROUND shipments.
PLANT14 recorded the highest warehouse utilization, while PLANT08 had the lowest fulfillment at approximately 82.19%.
21 products required immediate replenishment, with PLANT17 accounting for 20 of them.
Shipment weight was the most influential feature in the Random Forest shipment-cost model.
Carrier selection significantly affected shipment cost, while warehouse utilization alone did not significantly explain operational cost.
Business Recommendations
From findings
to action.
01
Optimize shipment planning
Use shipment weight and delivery mode insights to improve cost estimation and planning.
02
Review carrier performance
Compare carrier-level shipment costs and operational performance when selecting logistics partners.
03
Strengthen replenishment
Prioritize the 21 products requiring immediate reorder to reduce stock-out risk.
04
Improve low-performing warehouses
Investigate operational practices at lower-fulfillment facilities such as PLANT08.
05
Monitor carrying costs
Track warehouse-level carrying costs and inventory efficiency to identify opportunities for improvement.
06
Use predictive analytics
Extend the shipment-cost model with stronger feature engineering, validation and tuning in future iterations.
Project Takeaway
Analytics is more than
dashboards and models.
LogiTech helped me understand how Excel, SQL, Python, Power BI, statistics and machine learning can work together to answer business questions and turn operational data into actionable insights.