Power BI · Business Intelligence
E-Commerce
Customer Behavior Analysis
An interactive Power BI analytics project built using the Olist Brazilian E-Commerce dataset to understand customer behavior, sales performance, product trends and business KPIs.
Project Overview
Turning e-commerce
data into decisions.
This project analyzes the Brazilian E-Commerce Public Dataset by Olist to understand customer purchasing behavior, order trends, product performance and revenue-related KPIs.
The data was transformed and modeled in Power BI using Power Query and DAX, followed by the development of an interactive multi-page business intelligence dashboard.
The goal was to convert raw transactional data into clear visual insights that can support business monitoring, customer analysis and strategic decision-making.
Orders
99K+
E-commerce orders analyzed
Platform
Power BI
Interactive BI dashboard
Data Preparation
Power Query
Cleaning and transformation
Dashboard
4 Pages
Interactive analytical views
Business Objectives
Questions behind
the dashboard.
01
Customer Behavior
Understand customer purchasing patterns and overall customer activity.
02
Revenue & Orders
Analyze order trends and revenue-related business KPIs.
03
Product Performance
Identify product and category-level performance patterns.
04
Customer Analysis
Explore customer-level and geographic patterns in the dataset.
05
Business KPIs
Create interactive metrics to monitor important e-commerce indicators.
06
Decision Support
Present findings through an interactive dashboard for business users.
Data Workflow
From raw data
to interactive insights.
01
Import
Load Olist e-commerce datasets.
02
Clean
Transform data using Power Query.
03
Model
Build relationships between datasets.
04
DAX
Create measures and business KPIs.
05
Visualize
Build interactive Power BI pages.
06
Analyze
Extract business insights.
Dashboard Architecture
Four analytical views.
Executive Overview
High-level business KPIs and overall e-commerce performance.
Customer Analysis
Customer behavior, purchasing patterns and customer-level insights.
Product Analysis
Product and category performance across the e-commerce dataset.
AI Insights
A dedicated analytical view designed to surface additional business insights.
Dashboard Gallery
Exploring the
e-commerce story.
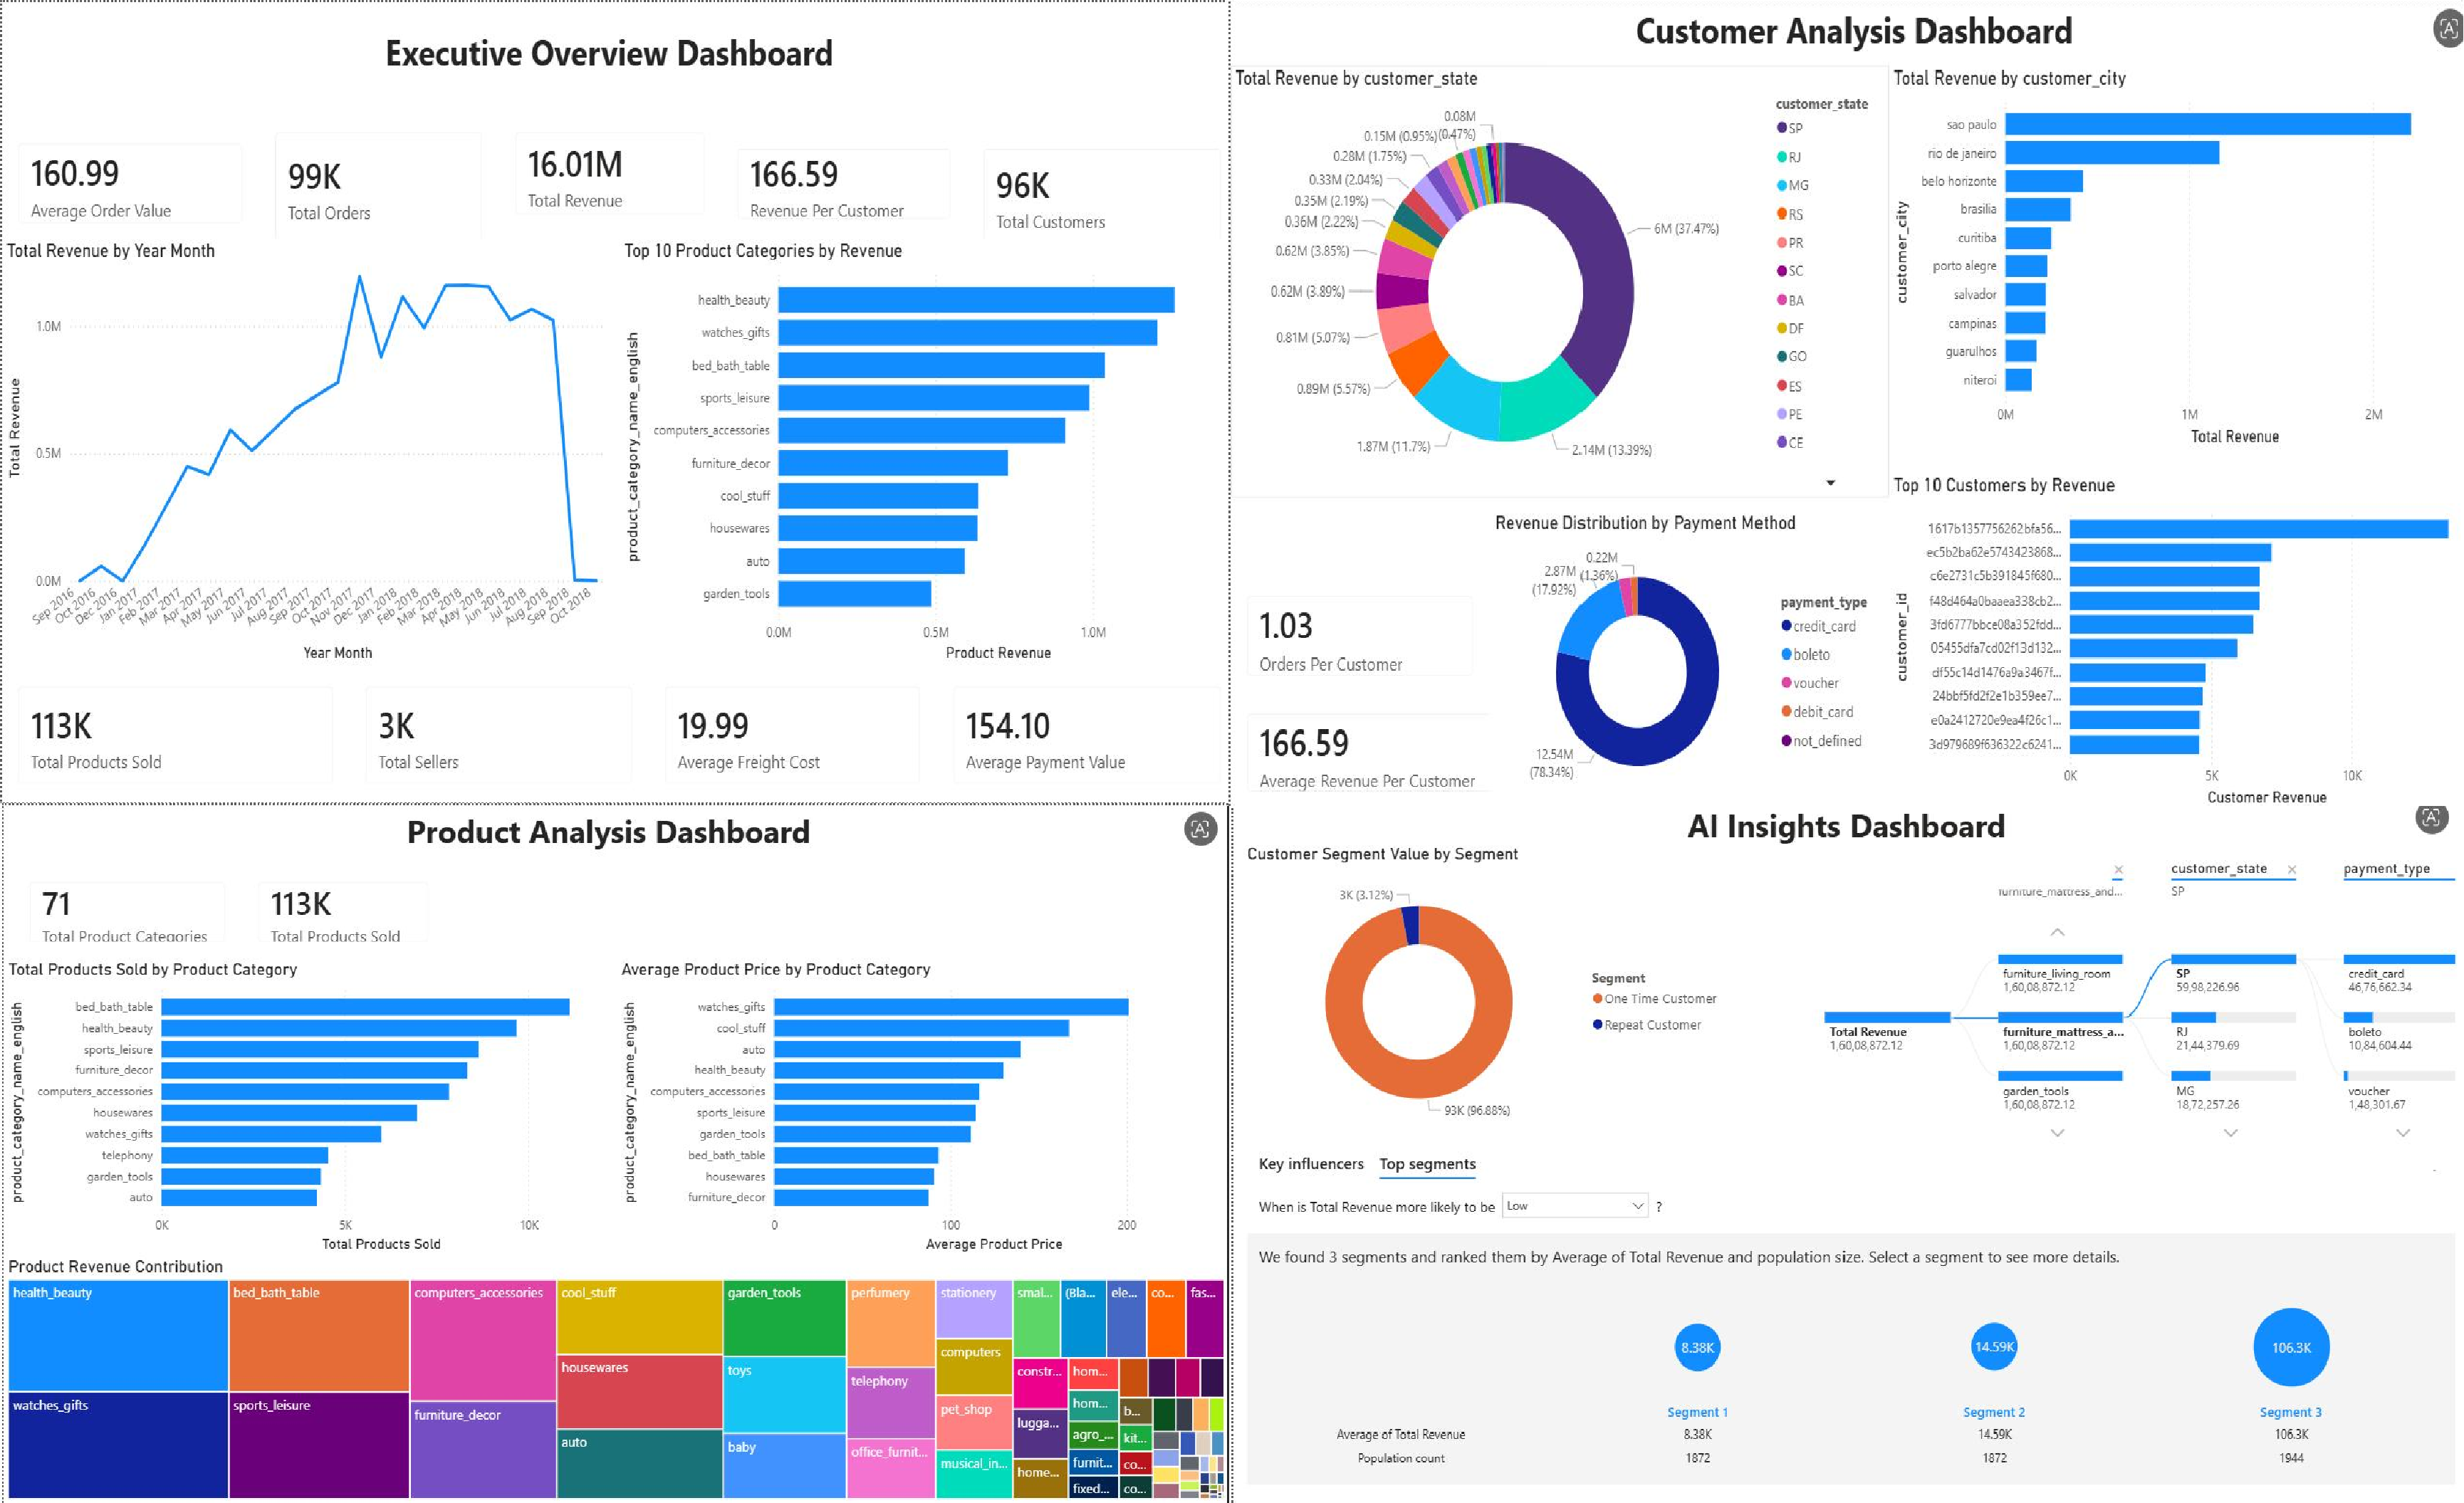
The Power BI report contains four interactive analytical views covering executive performance, customer behavior, product performance and AI-assisted insights.
01 · Executive Overview
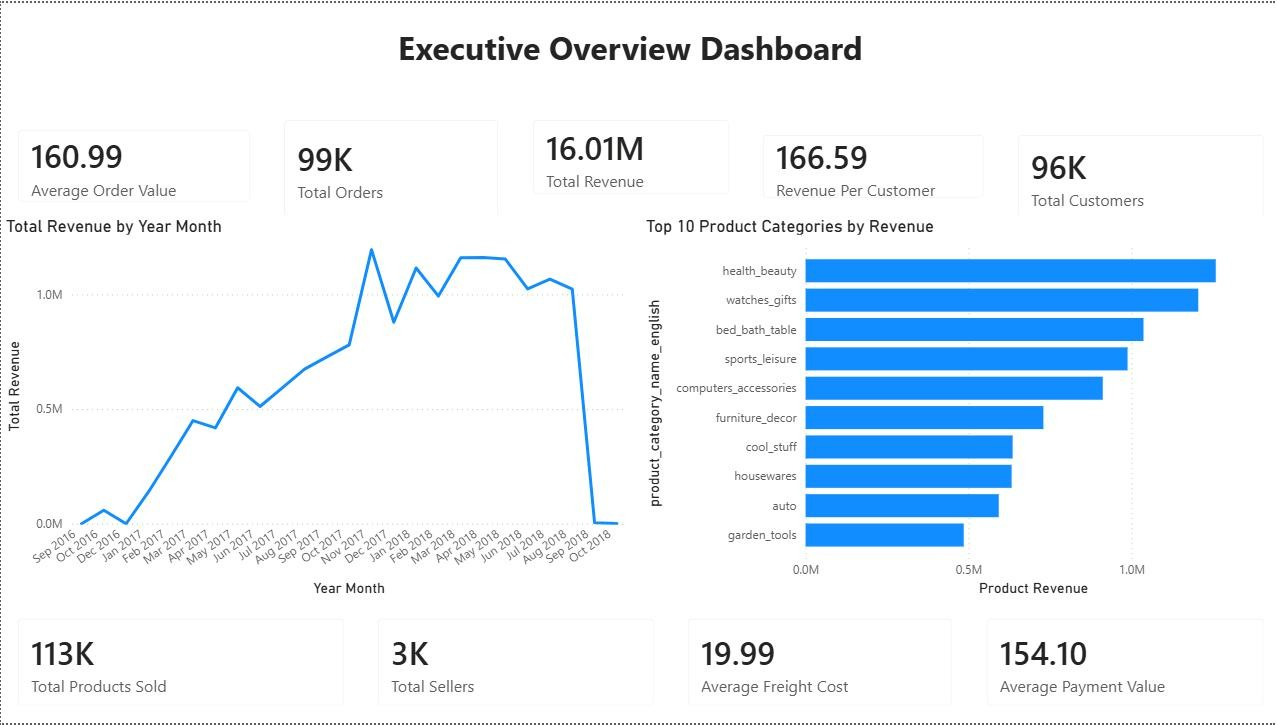
Executive Overview Dashboard
A high-level view of orders, revenue, customers, product sales, freight cost and overall business performance.
02 · Customer Analysis
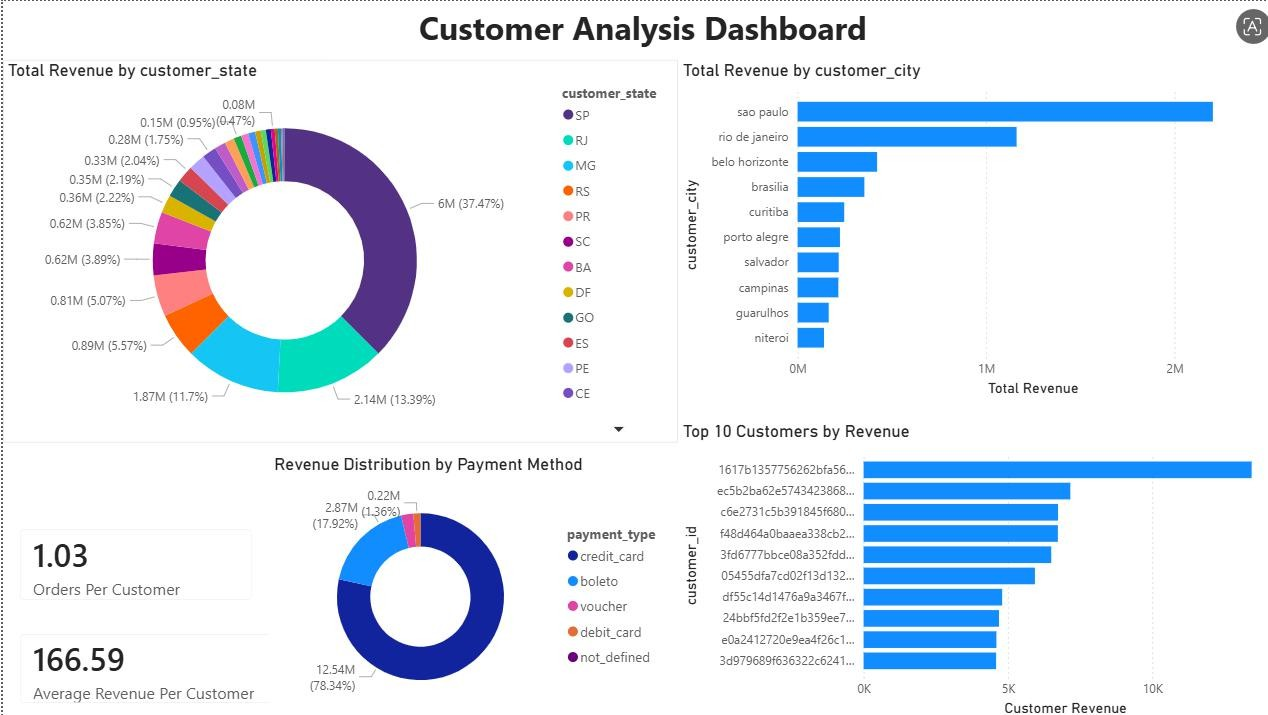
Customer Analysis Dashboard
Analyzes customer revenue by state and city, payment behavior, customer revenue contribution and customer-level performance.
03 · Product Analysis
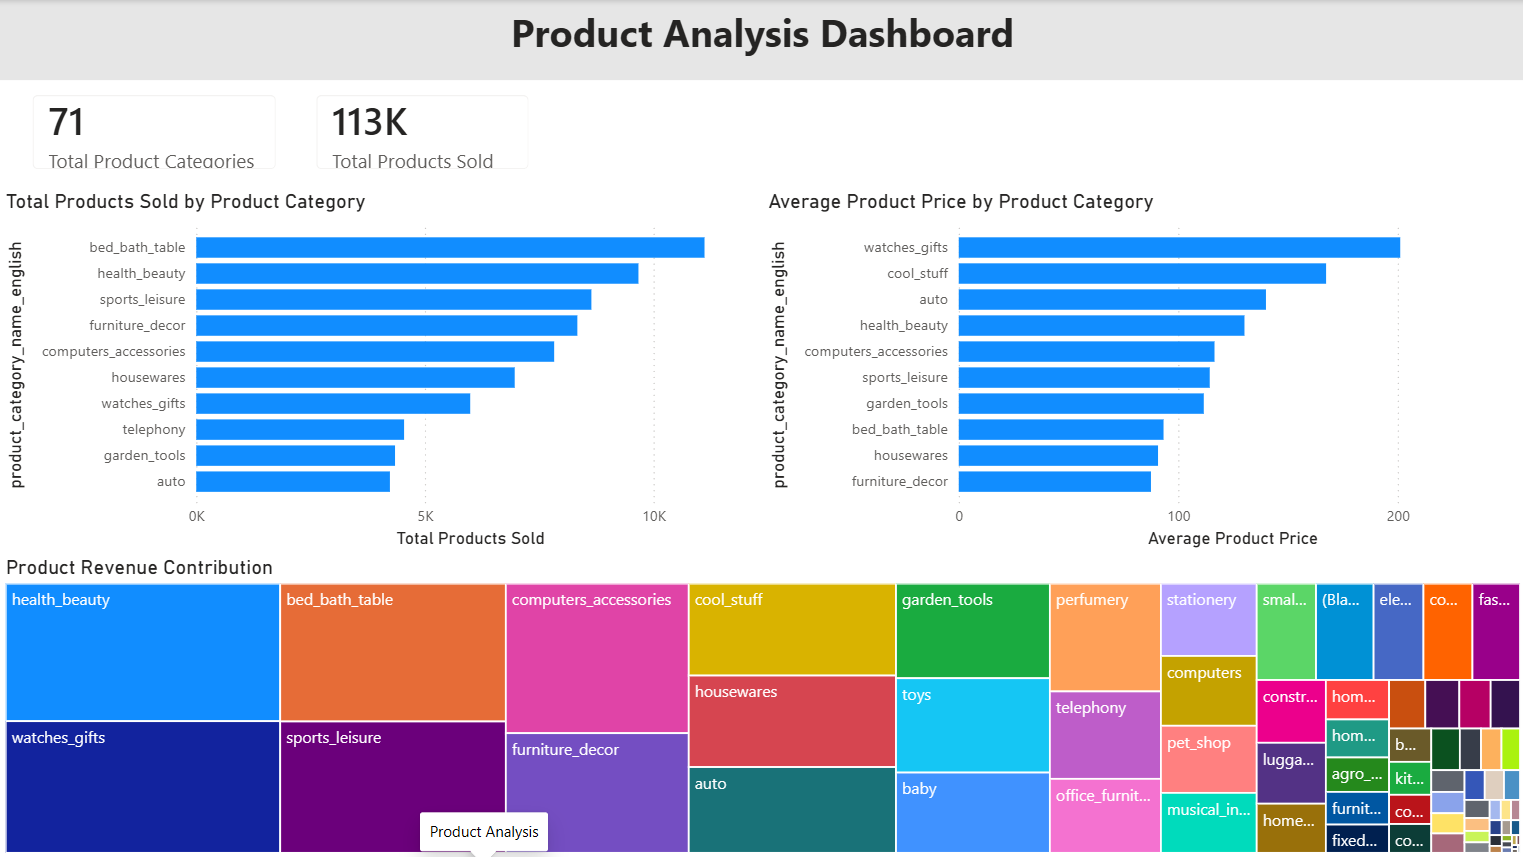
Product Analysis Dashboard
Examines product categories, total products sold, average product price and product revenue contribution.
04 · AI Insights
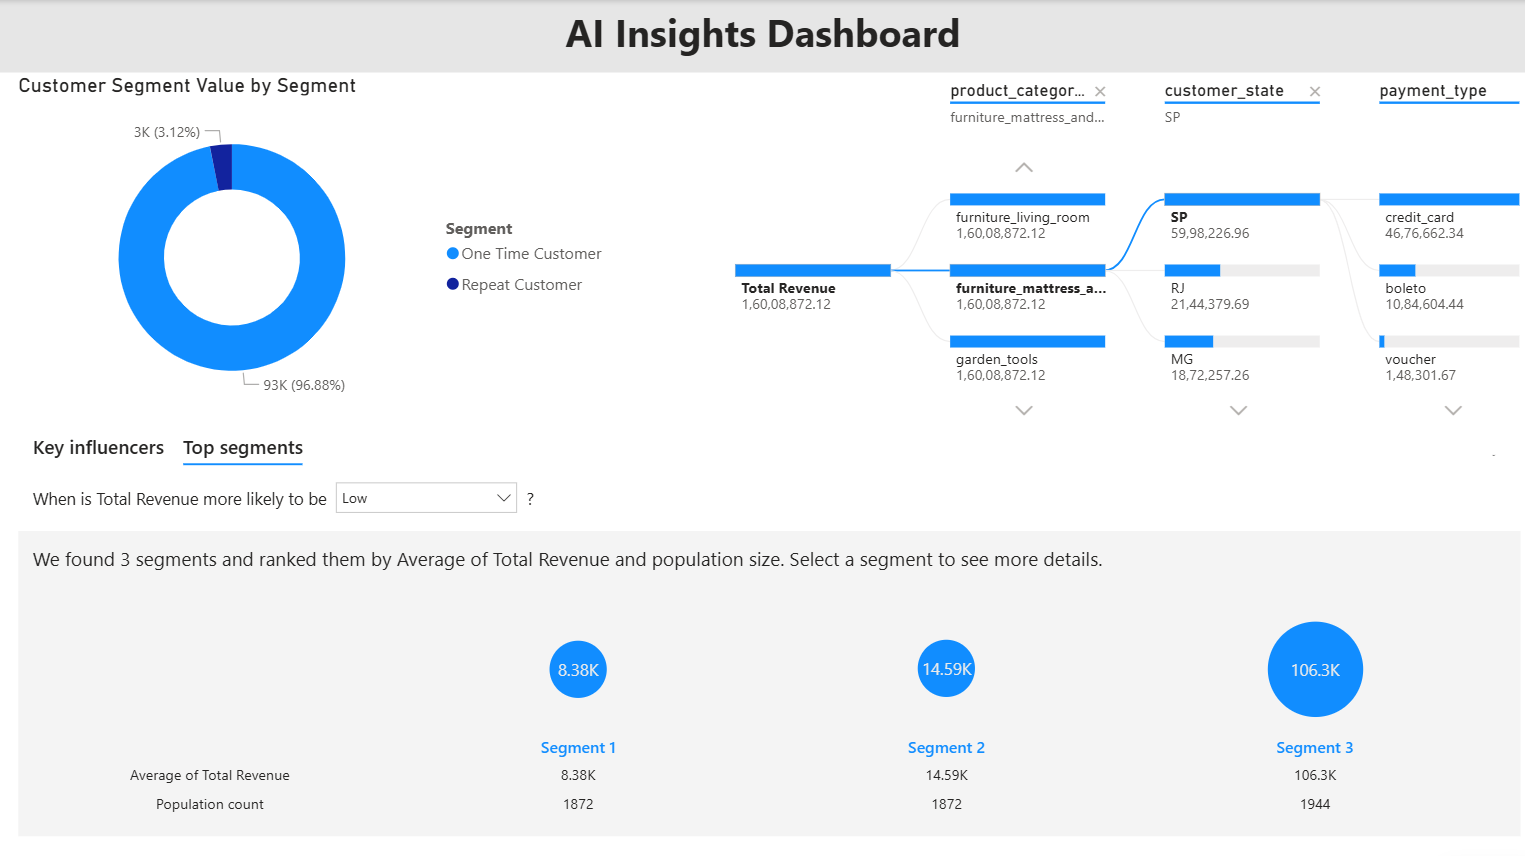
AI Insights Dashboard
Uses Power BI analytical capabilities to explore customer segments, revenue patterns and the factors associated with customer value.
Complete Report
Full Dashboard Overview
A consolidated view of the four Power BI dashboard pages.
Technical Implementation
Built for
business intelligence.
Power Query
Data cleaning, transformation and preparation.
Data Modeling
Structured relationships between e-commerce datasets.
DAX
Measures and calculated business metrics.
Power BI
Interactive dashboards and data visualization.
Business Analysis
Translating visual patterns into actionable insights.
Project Takeaway
From transactions
to business intelligence.
This project strengthened my ability to clean, model, analyze and visualize real-world transactional data while using Power BI to communicate business insights through interactive dashboards.