Python · Data Analytics · Machine Learning
Banking Customer
Churn Analysis
An end-to-end customer churn analysis project using Python, exploratory data analysis, statistical testing, machine learning, and an interactive Streamlit dashboard to identify churn drivers and support customer retention strategies.
Dataset
10,000
Customer records
Churned
2,037
Customers who exited
Churn Rate
20.37%
Overall customer churn
Best Model
Random Forest
86.45% accuracy
Interactive Dashboard
Explore the
churn dashboard.
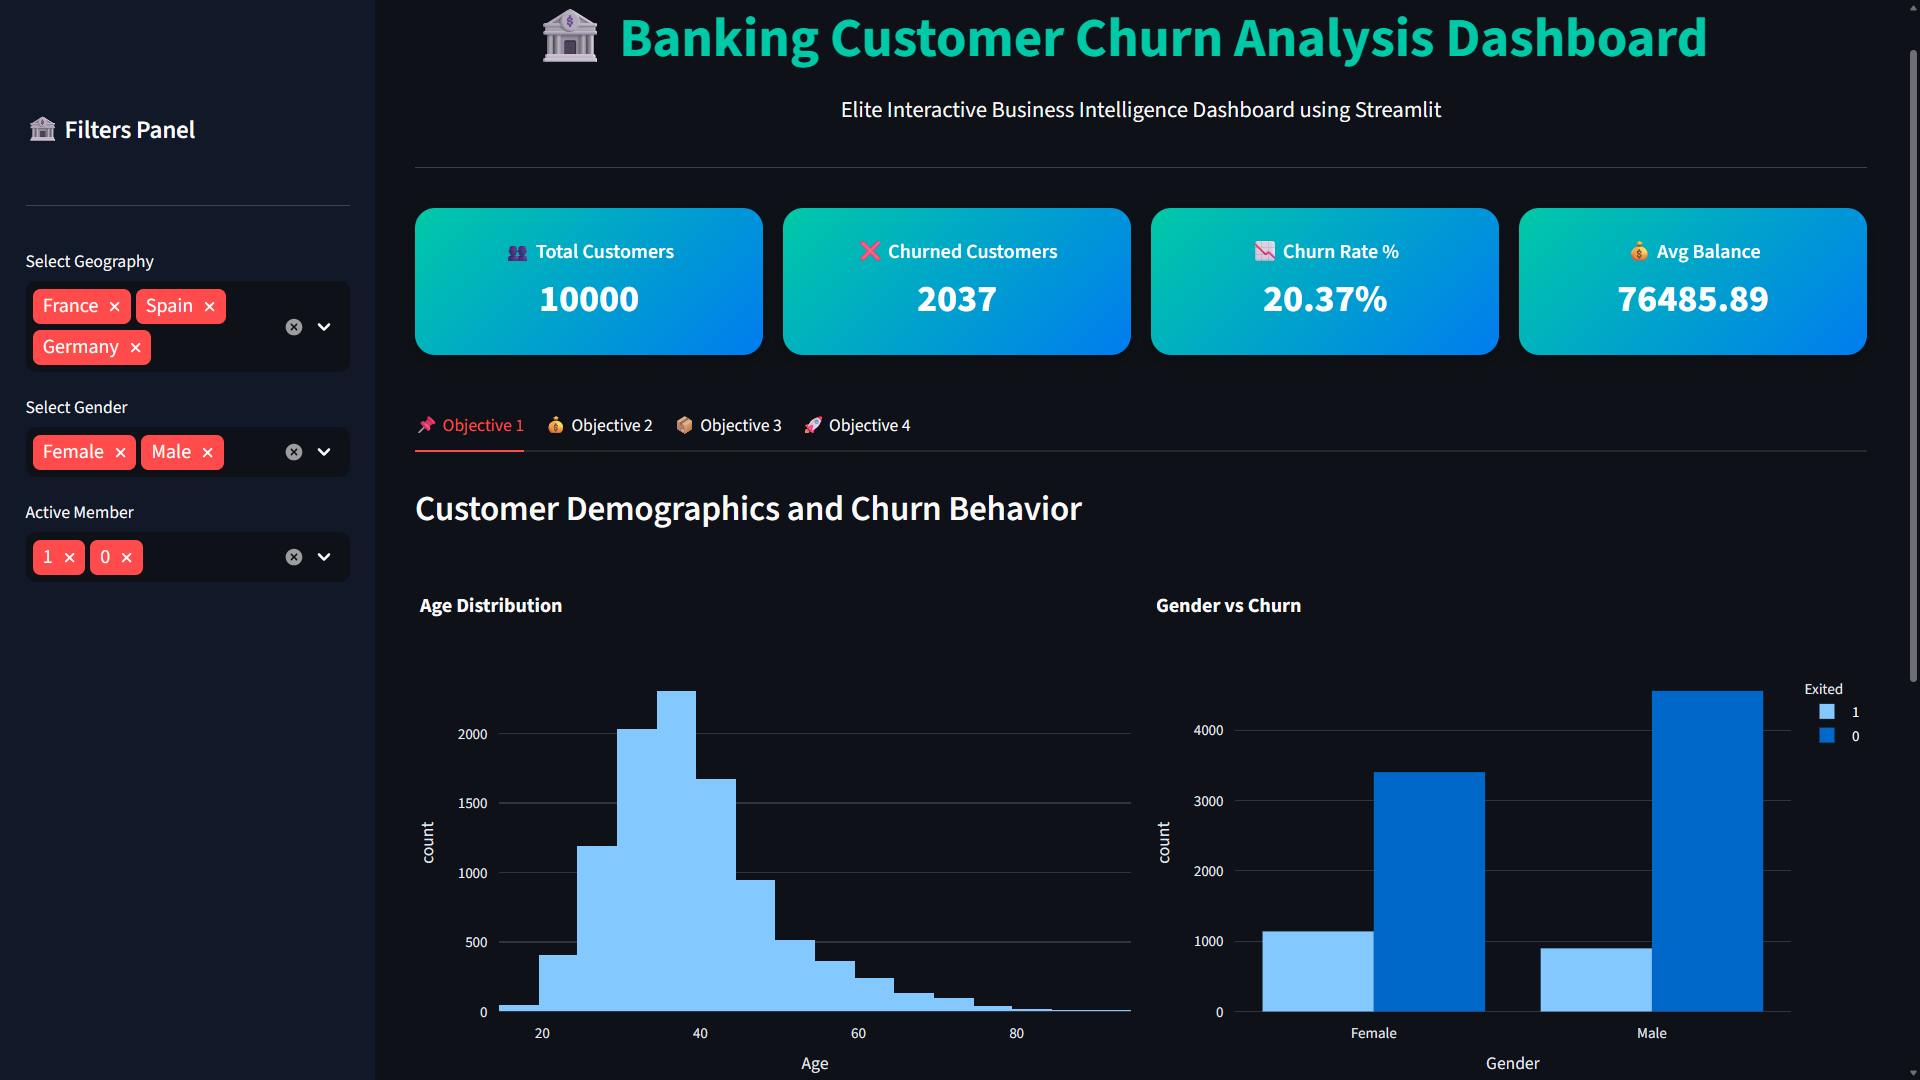
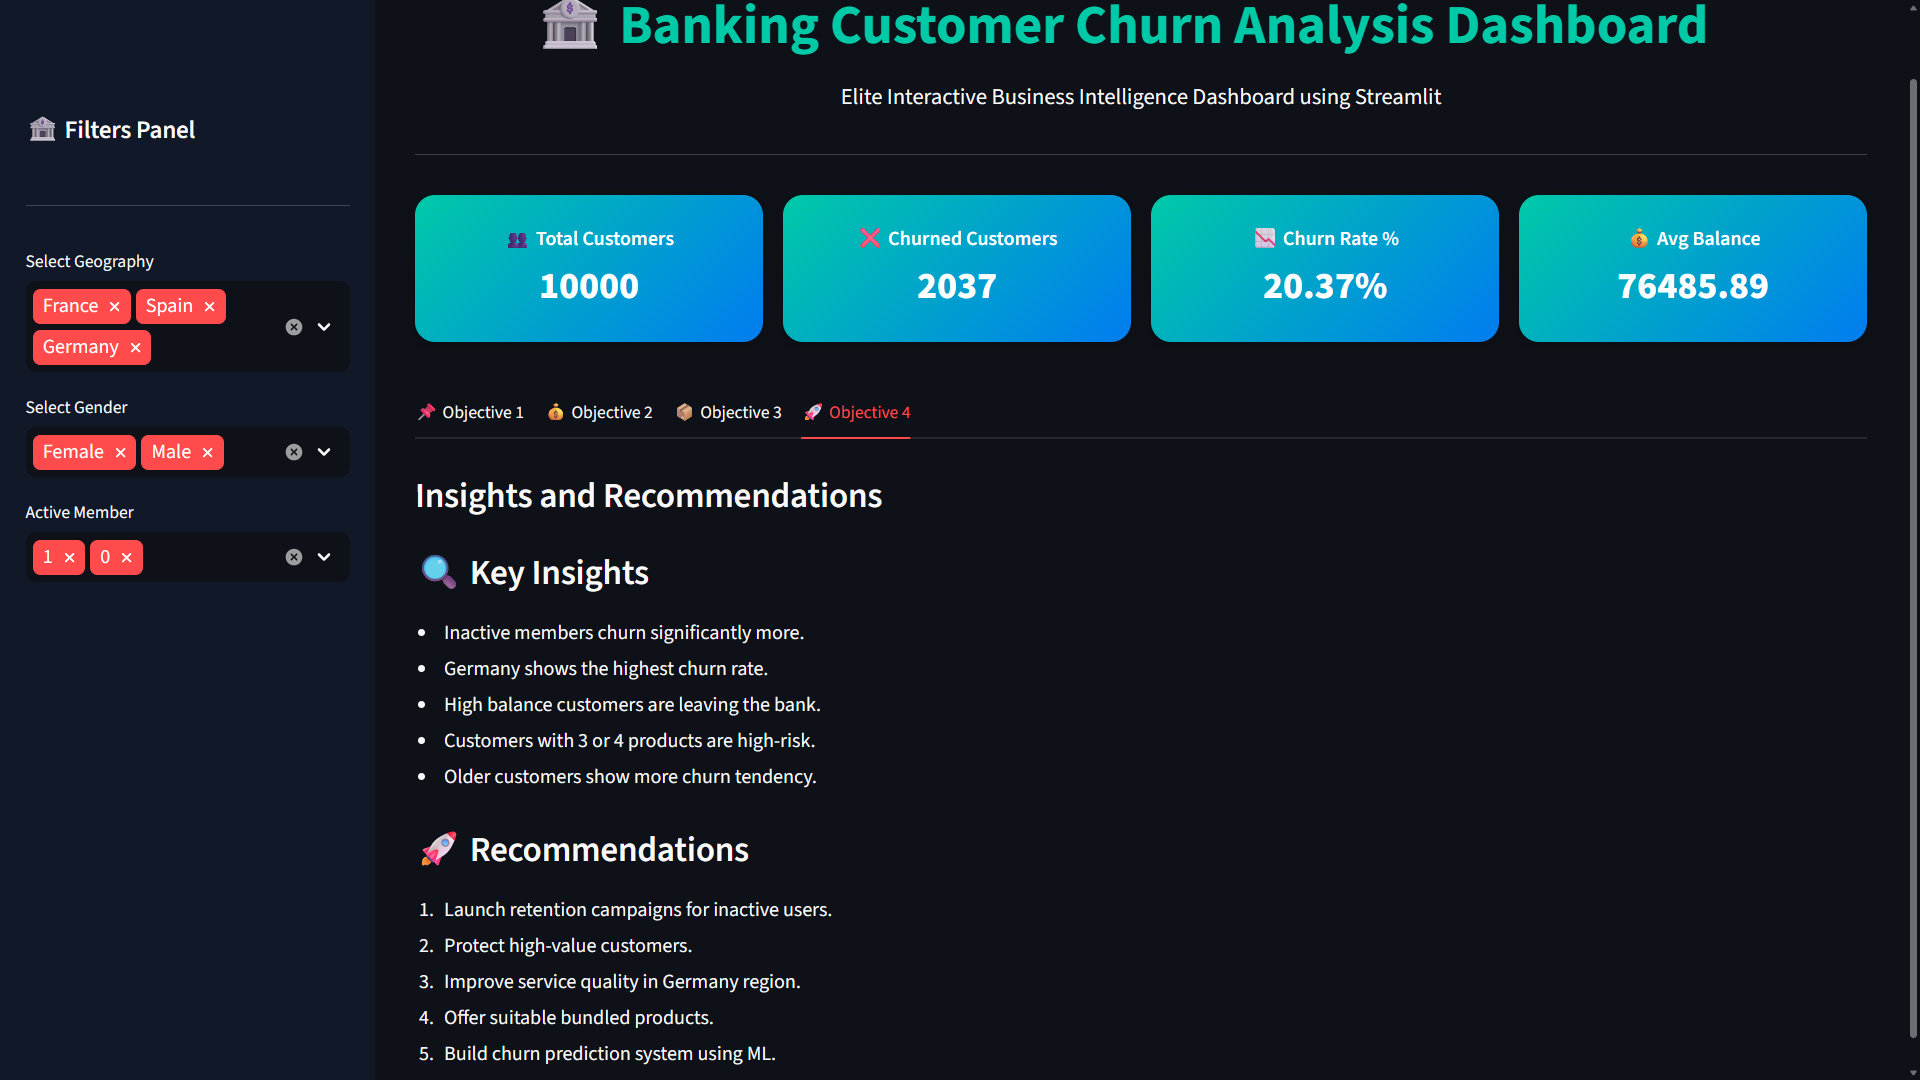
The Streamlit dashboard was designed to provide interactive monitoring of customer churn through KPI cards, filters, demographic analysis, financial analysis, engagement analysis, and actionable recommendations.
Dashboard Overview
Customer demographics and churn behavior
Insights & Recommendations
Key churn drivers and retention recommendations
Project Overview
Understanding
customer churn.
Customer churn is a major challenge in banking because losing customers can affect revenue and business growth.
This project analyzes the Kaggle Churn Modelling Dataset to identify patterns and factors associated with customers leaving the bank.
The analysis combines exploratory data analysis, statistical testing, machine learning and interactive visualization to turn customer data into actionable retention insights.
Dataset
The data behind
the analysis.
The project uses the Kaggle Churn Modelling Dataset containing demographic, financial and customer-engagement information.
Source
Kaggle – Churn Modelling Dataset
Rows
10,000
Columns
14
Target
Exited
0
Customer stayed
1
Customer left
Project Objectives
Five analytical
objectives.
01
Customer Demographics
Analyze age, gender, geography and high-risk customer segments.
02
Financial Factors
Study credit score, account balance and salary patterns related to churn.
03
Product & Engagement
Analyze product usage, credit card ownership, active membership and loyalty behavior.
04
Insights & Retention
Identify major churn factors, build customer profiles and suggest retention strategies.
05
Interactive Dashboard
Build a Streamlit dashboard with KPI cards, filters and objective-wise analysis.
Project Flow
From raw customer data
to actionable insights.
01
Data Collection
Imported and inspected the banking dataset.
02
Data Cleaning
Prepared the dataset for analysis and modeling.
03
EDA & Statistics
Explored churn patterns and validated relationships.
04
ML & Dashboard
Built predictive models and an interactive dashboard.
Objective 1
Customer demographics
and churn behavior.
Age
Older customers showed a higher tendency to churn.
Geography
Germany recorded the highest churn rate among the three regions.
Gender
Female customers exhibited a higher churn rate despite having a smaller overall customer base.
Objective 2
Financial factors
affecting churn.
Account Balance
Customers with higher account balances were more likely to leave the bank.
Credit Score
Credit score showed only a weak relationship with customer churn.
Estimated Salary
Estimated salary was identified as an important factor during the analysis and feature-importance evaluation.
Objective 3
Product usage
& engagement.
Number of Products
Customers with 3 or 4 products were identified as high-risk segments.
Active Membership
Inactive members showed significantly higher churn than active members.
Credit Card
Credit card ownership showed no significant impact on customer churn.
Statistical Analysis
Validate the patterns
before drawing conclusions.
Chi-Square Test
Categorical Relationships
Chi-square testing was performed to investigate relationships between categorical customer characteristics and churn.
Independent T-Test
Numerical Differences
Independent t-tests were conducted as part of the statistical validation of customer churn patterns.
Statistical analysis supported the conclusion that customer demographics and banking behavior influence churn, while credit card ownership did not show a significant impact.
Machine Learning
Predicting customers
at risk of churn.
Five classification models were trained and evaluated to identify the strongest approach for predicting customer churn.
| Model | Accuracy | Result |
|---|---|---|
| Logistic Regression | 80.80% | Baseline |
| Decision Tree | 85.60% | Strong |
| Random Forest | 86.45% | Best |
| KNN | 82.40% | Competitive |
| Gaussian Naive Bayes | 78.65% | Lowest |
Final Model
Random
Forest.
Random Forest achieved the highest predictive performance among the five evaluated classification models and was selected as the final churn prediction model.
Prediction Accuracy
86.45%
Precision
78.33%
Recall
46.19%
F1 Score
58.11%
ROC-AUC
85.26%
Feature Importance
What influenced
churn prediction?
01
Age
Most influential feature
02
Estimated Salary
Important financial factor
03
Credit Score
Important customer attribute
04
Balance
Important financial factor
05
Number of Products
Important behavioral factor
Key Insights
What the analysis
revealed.
Inactive members churn significantly more.
Germany shows the highest churn rate.
Higher-balance customers are more likely to leave.
Customers with 3 or 4 products are high-risk segments.
Older customers show a higher tendency to churn.
Age was identified as the most influential feature in the machine learning analysis.
Retention Strategies
Turning insights
into action.
01
Re-engage inactive customers
Launch targeted retention campaigns to increase engagement among inactive members.
02
Protect high-value customers
Develop special benefits and retention offers for high-value customers.
03
Region-specific strategies
Develop targeted retention strategies for regions with higher churn, particularly Germany.
04
Personalized offers
Use customer characteristics to design more relevant banking offers and services.
05
Product strategy
Review customers with multiple products and offer suitable bundled solutions.
06
Proactive prediction
Use the Random Forest model to help identify customers who may be at higher risk of churn.
Challenges
What made the project
challenging?
01
Understanding banking churn business logic.
02
Selecting suitable visualizations.
03
Handling outliers effectively.
04
Building an interactive dashboard.
GenAI Usage
AI-assisted
project development.
Generative AI was used for planning objectives, generating summaries, improving project storytelling and assisting with documentation.
Project Takeaway
From customer data
to retention strategy.
This project demonstrated how Python-based analytics, statistical analysis, machine learning and interactive dashboards can be combined to understand customer churn and support data-driven retention decisions.